
MTA Turnstile Study
For the first project of the Metis bootcamp, we were tasked with drawing insights from messy MTA subway turnstile data in NYC.
The problem
A women-in-tech nonprofit (WTWY) wants to improve their outreach strategy. They have an annual gala coming up, and they want to raise awareness and collect signatures from folks who might attend the gala or contribute to their organization by placing street teams at subway entrances.
The Approach
With the goal of raising awareness and donations made clear, we need to think about who to target. An easy strategy is to target subway stations with high volume of commuters. We can simply clean and munge the data and find out which stations have a lot of people exiting and entering their turnstiles (most likely near Grand Central, Times SQ, etc.).
Our team decided that this approach would not be enough as it ignores the goal of raising donations. To address this, we incorporated data on the income of NYC residents and local property values. We used zipatlas.com for data on residents’ income and trulia.com for home and apartment prices.
Data Pre-Processing
Cleaning the MTA turnstile data proved to be the real challenge. We ran into issues like inconsistent station names and unrealistic jumps in turnstile counts. This definitely tested our team’s data cleaning abilities and patience. It also forced us to make decisions on what data we should keep or toss out.
We then collected the income and property value data and had to figure out how to best incorporate it. Being that the turnstile entries ranged in the thousands on a daily basis, and the other data went into the millions, we needed to standardize it by converting to z-scores.
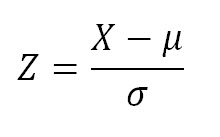
X is each data point, mu is the mean of the sample, and sigma is standard deviation.
With the data standardized, we were then able to attribute each subway station with an overall score of their likelihood to be near potential donors. We decided to weight each category (number of entries, income, and property value) with a 60-20-20 distribution. We felt the entries to the subway deserved the most weight. Now we were able to visualize and start drawing insights.
Findings - EDA
If we simply ranked the stations by volume of entries, it would come out like this:
High-Traffic Stations
- 34th Street–Penn Station
- Grand Central–42nd Street
- 34th Street–Herald Square
- 14th Street–Union Square
- 42nd Street–Times Square
- 42nd Street–Port Authority
- Fulton Street
- 125th Street
- 59th Street-Columbus Circle
- 96th Street
Then after applying our income and wealth data and scoring each station accordingly, the rankings shifted:
High-Potential Stations
Stations: Scores
- 14th Street–Union Square: 1.80
- 34th Street–Herald Square: 1.79
- 59th Street: 1.48
- Chambers Street: 1.36
- 59th Street–Columbus Circle: 1.18
- Canal Street: 1.13
- 96th Street: 0.83
- West Fourth Street–Washington Square: 0.60
- 14th Street: 0.56
- 72nd Street: 0.54
We see Chambers, Canal, and Columbus Circle jump way up! Interesting!
Also noteworthy is that Union SQ and Herald SQ are at the top in both rankings. We should probably focus a lot of energy there!
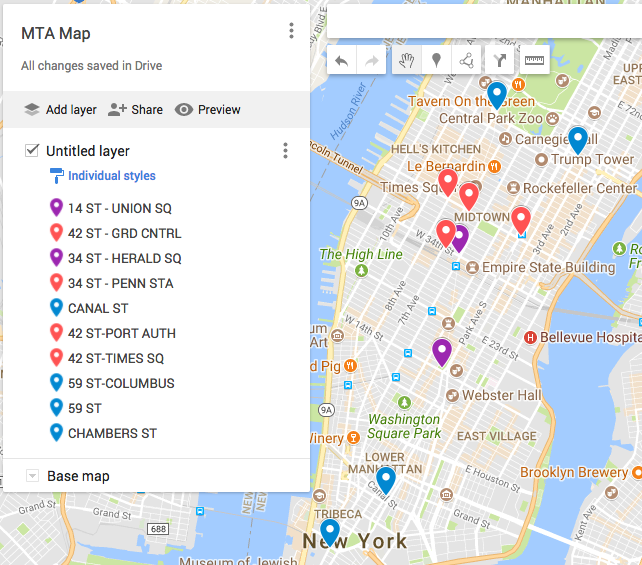
Here’s a map of our top stations:
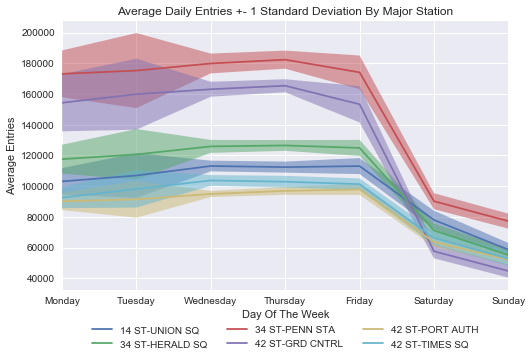
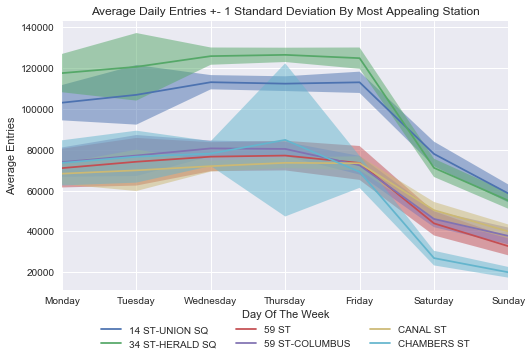
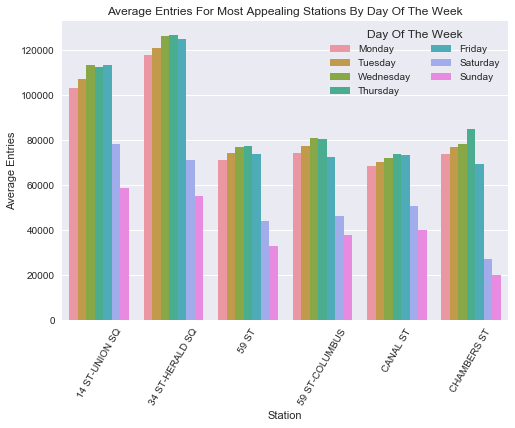
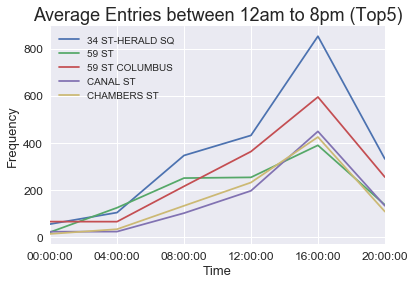
Now we can look at the subway rider volume by day of the week and time of day to get an idea of when to look for donors.
Summary and Conclusions
• Send larger teams to 14th Street–Union Square and 34th Street–Herald Square.
• Send smaller teams to 59th Street (Lexington Avenue), 59th Street–Columbus Circle, Canal Street and Chambers Street.
• Focus on weekday afternoons when subway traffic is higher (but all day for 34th Street–Herald Square).
• But also send a team to 14th Street–Union Square on weekends.