
Instacart Market Basket Analysis (Kaggle Competition)
Finished in top 21% of the private leaderboard
I had my eye on this competition for a couple months and, after my first few weeks of some intensive learning at Metis bootcamp, I felt like I was ready to officially take it on.
For anyone who hasn’t heard of Instacart:
“Whether you shop from meticulously planned grocery lists or let whimsy guide your grazing, our unique food rituals define who we are. Instacart, a grocery ordering and delivery app, aims to make it easy to fill your refrigerator and pantry with your personal favorites and staples when you need them. After selecting products through the Instacart app, personal shoppers review your order and do the in-store shopping and delivery for you.”
As someone who dreads grocery shopping, it sounds like I am their target customer.
Well, I would be if I knew how to make any food other than Digiorno pizza or Eggo waffles…I should probably learn how to cook…
But I digress
Instacart’s Data Science team currently uses transactional data to develop models that predict which products a user will buy again, try for the first time, or add to their cart next during a session. These models have a huge impact on optimizing the user experience as they can recommend products based on a user’s past behavior.
The Competition
Kaggle opened this competition a few months ago to see who could best use Instacart’s open sourced data to predict what products people will repurchase in their next order. The data includes a sample of 3 Million Orders from over 200,000 customers. Each customer has made anywhere from 4 to 100 orders. Each order includes information of the hour of day, day of week, days between previous orders, etc.
Data Pre-Processing
As the data was split into separate csv files (the users and orders, products in each orders, department names, etc.), I needed to group everything together so that I could start to extract meaningful features. Helpful features in modeling user behavior will be anything that can quantify user purchasing tendencies based on their history. Let’s look at the data to see what patterns we can identify that might be useful as features for our model.
EDA / Data Viz
Thinking about how people shop in general, it makes sense that items they add to their cart first are probably a priority to them. These are probably items that they order all of the time.
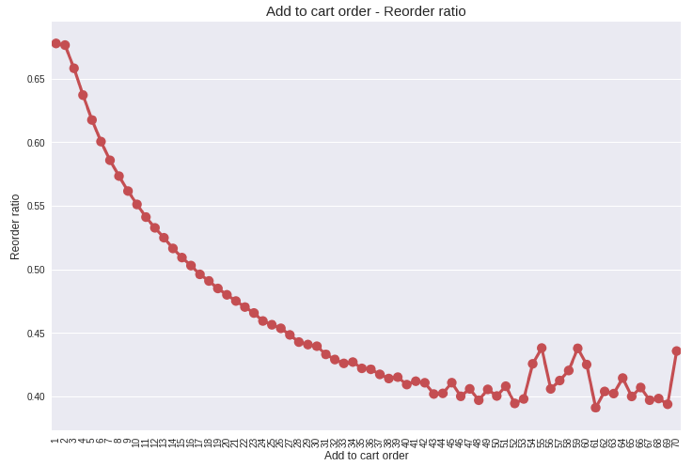
Just as we thought! The earlier a product is added to a customer’s cart, the more likely that product is to be reordered in the future.
How about looking at departments?
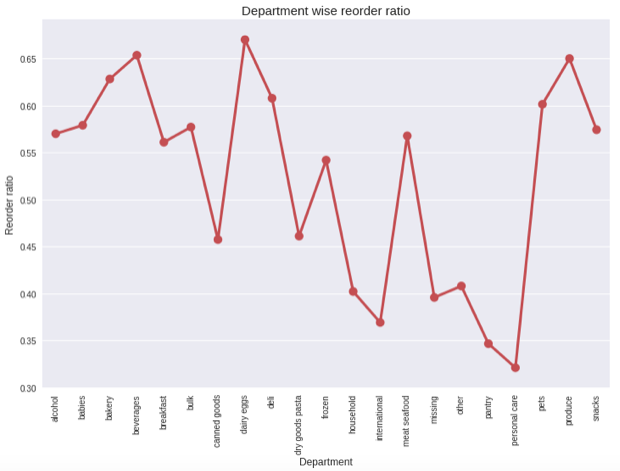
This makes sense too! Produce items get reordered a lot as they expire, but personal care items don’t get reordered quite as often. You don’t need new toothpaste every week…unless you have a huge family.
And check out this cool visualization of the department and aisle sizes made with d3! The bigger the bubble, the more popular the department/aisle/product.
I won’t add more feature charts here to keep from chart overload, but there is also a clear tendency for more items being bought earlier in the week as well as in the early morning or after work hours.
Feature Engineering!
With our EDA in mind, we can start to come up with some informative features. Here are some of the ones I found success with:
User Specific:
- Average Order Size
- Average Number of Reorders per Cart
- Average Days Between Orders
- Average Order Hour of Day
- Average Oder Day of Week
Product Specific (generalized over all users):
- Total Orders of Product
- Times Product was Reordered
- Product Reorder Probability (2 divided by 1)
- Department (categorical)
- Aisle (categorical)
User/Product Relationship:
- Average Cart Order
- Times User Ordered the Product
- Product Reorder Frequency (2 divided by total user orders)
- Orders Since Previous Product Order
- Days Since Previous Product Order
- Streak of Product Orders (number of orders in a row)
After putting all of this together, I can confidently say I am a dataframe groupby, aggregate, and merging master.
Modeling
Being that we are trying to predict whether a product will or will not be reordered, this makes it a binary classification problem. There are tons of algorithms that we can try, but for simplicity I’ll only consider two models:
- Logistic Regression (fast for our large amount of data)
- XGBoost (gradient boosted trees, always works well on Kaggle Comps)
Being that this is my first official crack at a Kaggle competition, I saw this as a great opportunity to become familiar with the famed XGBoost library (thank you Tianqi Chen!).
Now having used it, I am ALL ABOUT IT.
It is important to mention that this contest ranks submissions on F1 score (harmonic mean between precision and recall), which makes sense in this application. Instacart doesn’t want to send recommendations to people for products that they are not interested in. They also don’t want to miss an opportunity to convince someone to buy a product they likely will want. We will need to tune our model to maximize F1.
Classifications
When we run the models on our grouped data with all of our engineered features, we find that the probabilities for reorder are very low across the board. We’ll need to be more lenient than requiring over 50% reorder probability to classify as a reorder.
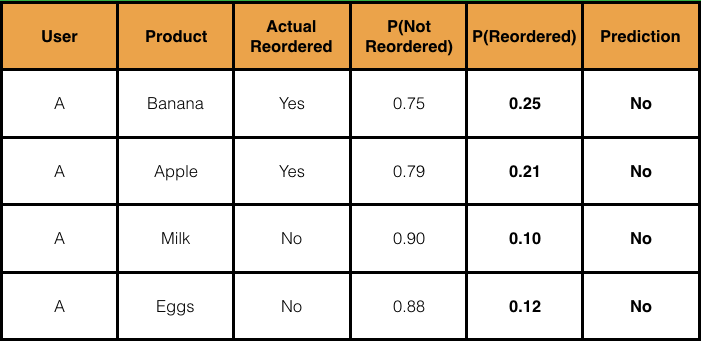
This (fake) data illustrates how difficult it will be to classify reorders. It makes sense though with the class imbalance. If we simply predicted “Not Reorder” for every product, we would be right about 85% of the time. 85% accuracy is great in some applications but not if we have 0 recall.
Let’s be more lenient here and make a 20% threshold for reorders:
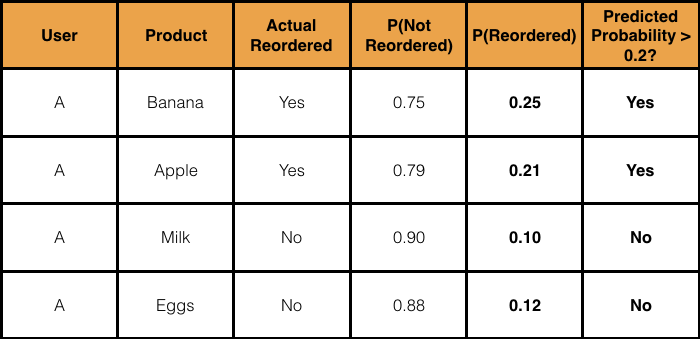
Now that captures the right classifications!
On a larger scale with the real data, we can run our models and get our reorder probabilities for each user/product. Then we can than try a bunch of thresholds and see which one yields the best F1 score!
Side note: This is when I moved my data to a 64GB RAM AWS Instance, the data was too much for my measly 8GB RAM Macbook. I shouldn’t complain though…I bought it off craigslist.
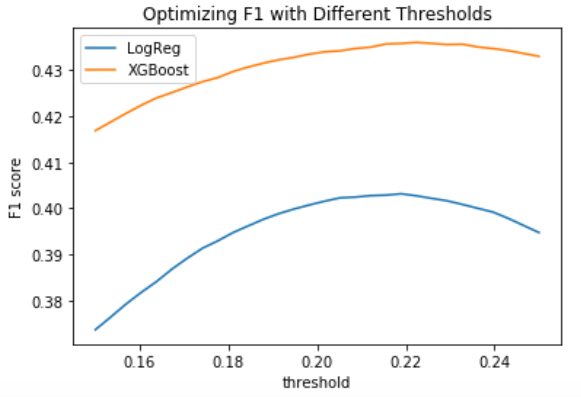
Great! So we’re seeing an optimal threshold set at around 0.21 or 0.22. It also looks like XGBoost outperforms logistic regression by a decent margin. I GET THE XGBOOST HYPE. We’ll use that when we create a Kaggle submission. Let’s look at the feature importances:
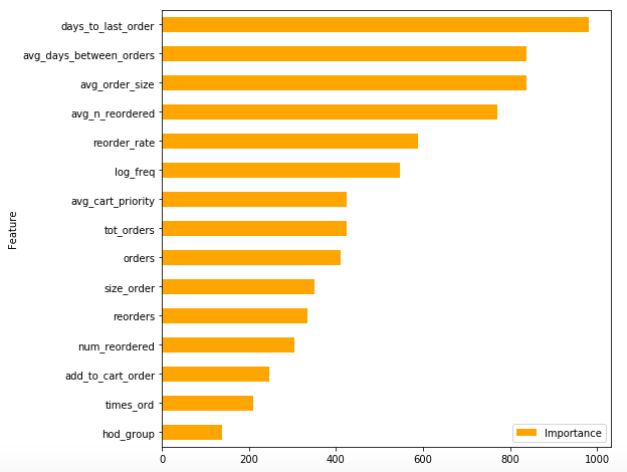
We see a bunch of our engineered features at the top of XGBoost’s model importance list. The hard work paid off!
“The Instacart Online Grocery Shopping Dataset 2017”, Accessed from https://www.instacart.com/datasets/grocery-shopping-2017
My github repo with my notebooks and code
Acknowledgments:
- Instacart for open-sourcing their data!
- Kaggle for hosting the competition
- Kaggle community for sharing so many ideas on the discussion board
- Joseph Eddy and Leang Chiang (Instagang) for collaborating on this data set at Metis