
The Value of Statcast Data in MLB
If you’ve watched any MLB games or ESPN over the past couple years, you most likely have heard the announcers talking about Statcast or launch angles/velocities. Baseball fans and announcers are having a lot of fun with this relatively new way to analyze the game.
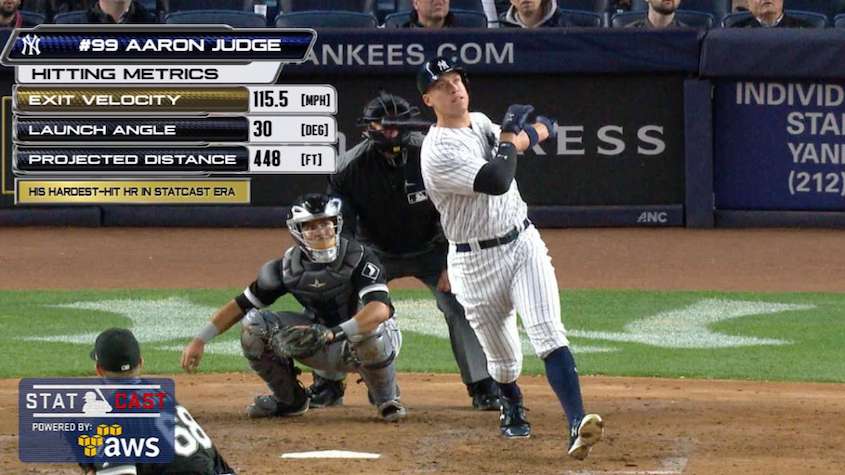
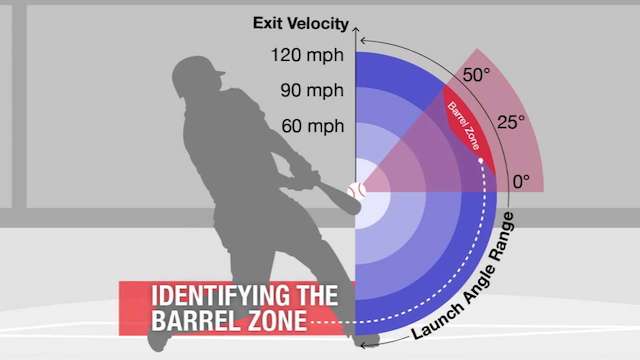
For those who have not heard of Statcast, it is just a tool that uses super powerful high-speed cameras installed in every pro baseball stadium that are capable of measuring aspects of the game that were not possible before. When you hear people talk about launch angle and velocity, they are referring to the angle and speed that the baseball leaves the bat when someone hits the ball. Statcast is essentially really good at measuring this exact moment:
Statcast captures many more metrics like the angle and spin of an incoming pitch, the range of fielders on each play, and many more. Why is this significant? Is it significant?
The Big(ly) League Problem
Measuring the value of baseball players is extremely difficult. General Managers of baseball teams struggle to efficiently spend money to field a winning team. They can’t afford to pay players who underperform too much money. Ever since the (can’t avoid the cliché reference for any baseball stats related topic) Moneyball era, teams are getting better at making data-driven decisions rather than accepting outdated practices in judging talent.
Where can Statcast data fit in this?
Can we predict a player’s true value accurately by looking solely at their Statcast data?
Let’s see how much a player’s average launch angle, velocity, and barrels can tell us about them.
The Approach
When we say player value, in baseball that means WAR, or Wins Above Replacement. If you want to read more about it, or any baseball stats for that matter, go to FanGraphs. If you don’t care for the details, it is just an overall measure of how many more wins a player contributes to a baseball team than some replacement player on the bench.
We can create two regression models, one using strictly Statcast data, and another using traditional metrics to compare, and see which has higher predictability (R^2).
Note: I collected traditional player stats (plus some more advanced stats analyzing power and plate discipline) from FanGraphs since 2015. I used Baseball-Savant for collecting Statcast data over the same time period.
Tools used -Scraping: BeautifulSoup -Analysis: Python (Pandas, NumPy, Scikit-learn, etc.) -Visualizations: matplotlib, seaborn, bokeh
Data Viz / EDA
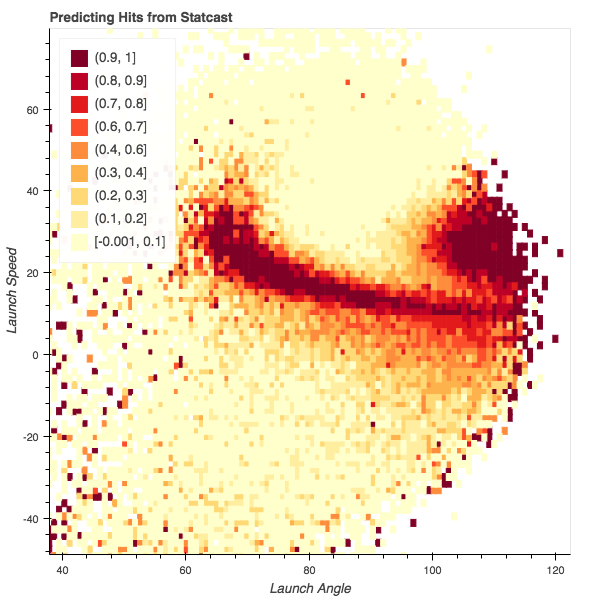
Looking at about 90,000 baseballs hit in play over that time period, we can see a clear relationship between likelihood of getting a hit and the angle/speed of the ball off the bat.
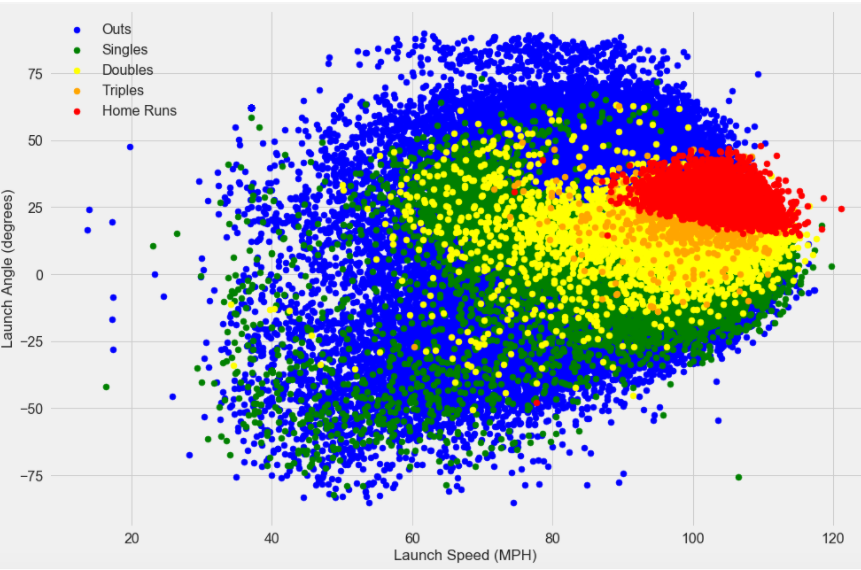
We can also see that you will gain more bases on a hit as you get closer to a sweet spot of angle/velocity.
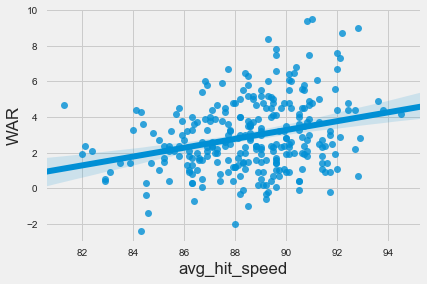
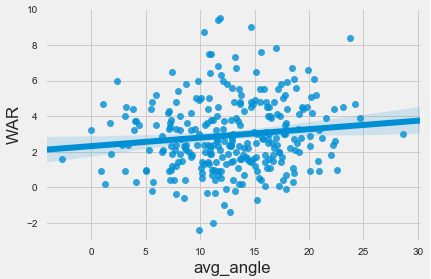
Now let’s compare some stat groups and see how they correlate to WAR.
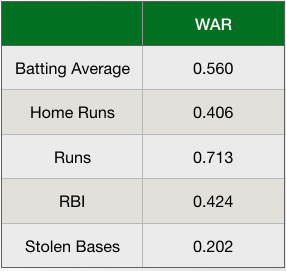
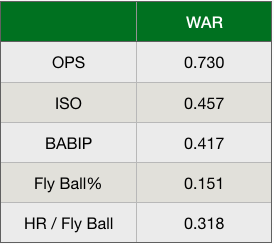
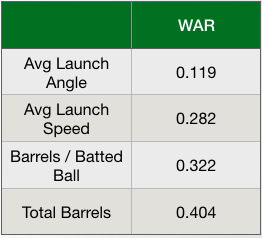
Wow! Statcast data does not have a strong correlation with WAR at all compared to the other metrics. This will probably mean it has low predictability.
Why Are the Correlations So Low for Statcast Data?
Here’s great example of why:
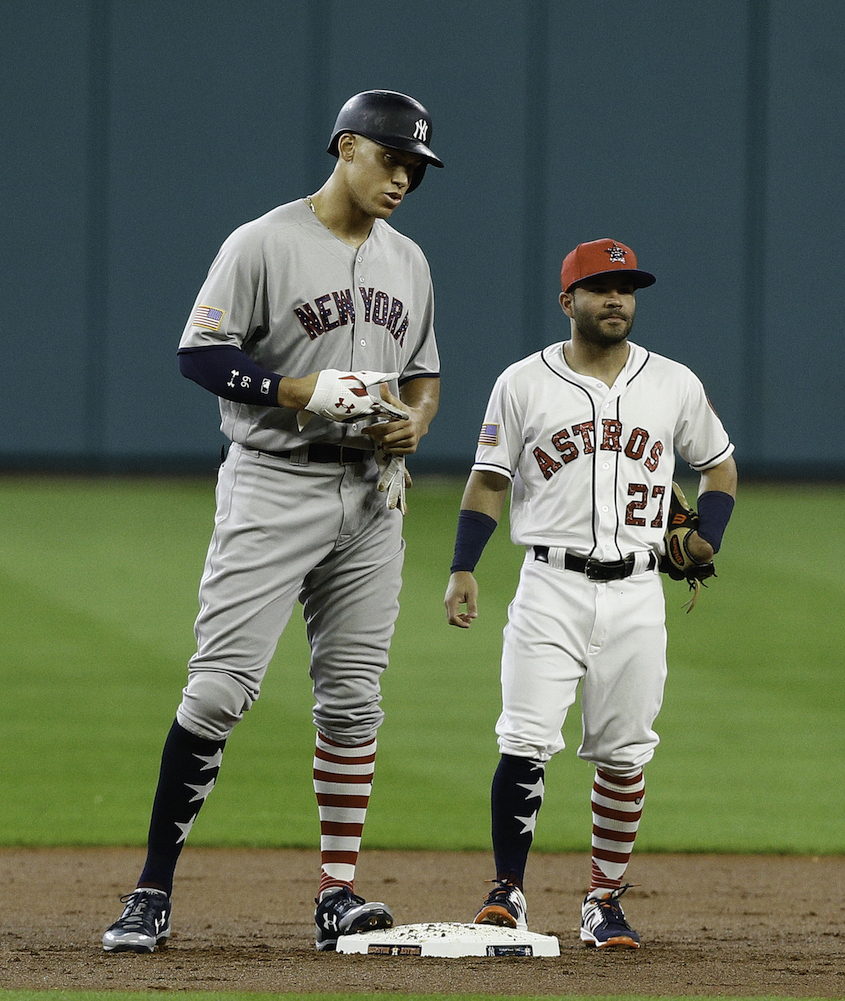
On the left is Aaron Judge (featured in the post header). He’s 6’ 7’’ and about 280 lbs. He’s a beast. Almost twice as big as the guy to his right, José Altuve, who is 5’ 6’’ and 165 lbs. No matter how hard Altuve tries, he is not going to hit the ball nearly as hard as Judge. Judge hits the ball with an average exit velocity of 96 MPH and barrels the ball 26.4% of the time while Altuve averages out at 85 MPH with a barrel occurring only 6.1% of the time. You might assume he is not as good at this game that revolves around hitting round things with sticks as hard as possible…
Well…
They are actually both the league leaders (Judge is ahead, but it’s close) in WAR! How is that possible!?
There must be a lot more to this game than power at the plate, which when you think about it, is what Statcast is mostly measuring.
We can prove this with linear models as well.
Modeling
I went ahead and made linear models combining the different eras of baseball statistics separately. I trained the models on 80% of my scraped data and below are the predicted vs. actual WAR values. The red line just shows y=x which would be indicate completely accurate prediction (1.0 R^2).
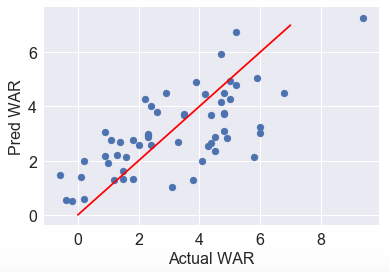
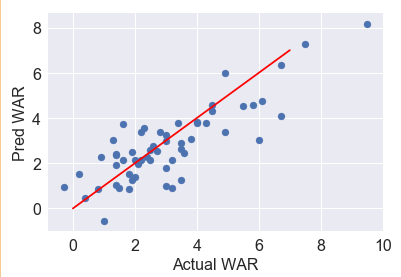
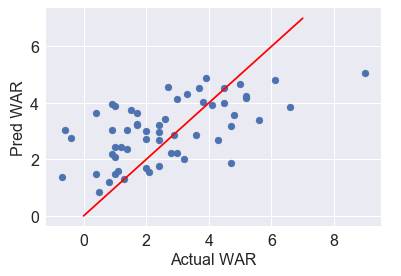
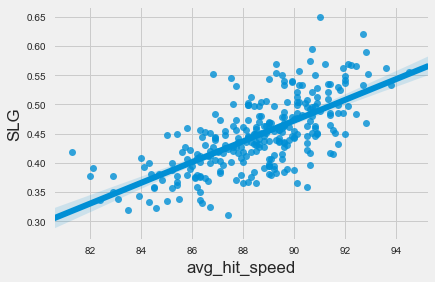
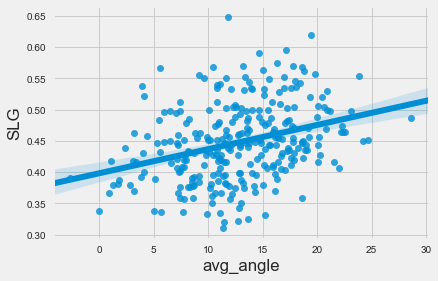
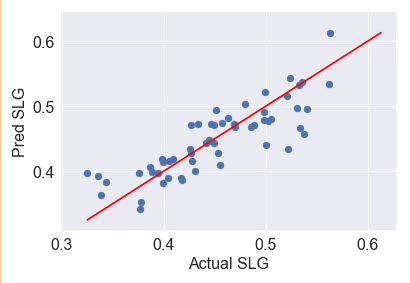
As we expected from the correlations earlier, Statcast data was not sufficient alone in predicting player WAR. Again, we see much stronger predictive ability for a player’s SLG numbers:
Conclusion and Thoughts
-
Baseball involves a lot of randomness, can’t expect a nearly perfect model.
-
Statcast is interesting, but we (a GM) will also need many more features to measure player value.
-
Stronger measure of a player’s slugging ability, so there is some value to Statcast!
-
Maybe better for player by player analysis rather than trying to generalize over the entire league.
Examples:
As a player gets older, their exit velocity likely falls. Statcast can be used to identify declining players.
On the other side, a coach might notice a player increasing their production at the plate. They look at the numbers and find that their launch angle has increased by 4 degrees since last season. The coach can tell them to keep swinging with that new uppercut! We have seen this in the MLB already
I definitely plan to return to this data set again to see what other Statcast data could be of value. Feel free to check out my code/notebooks on my github.